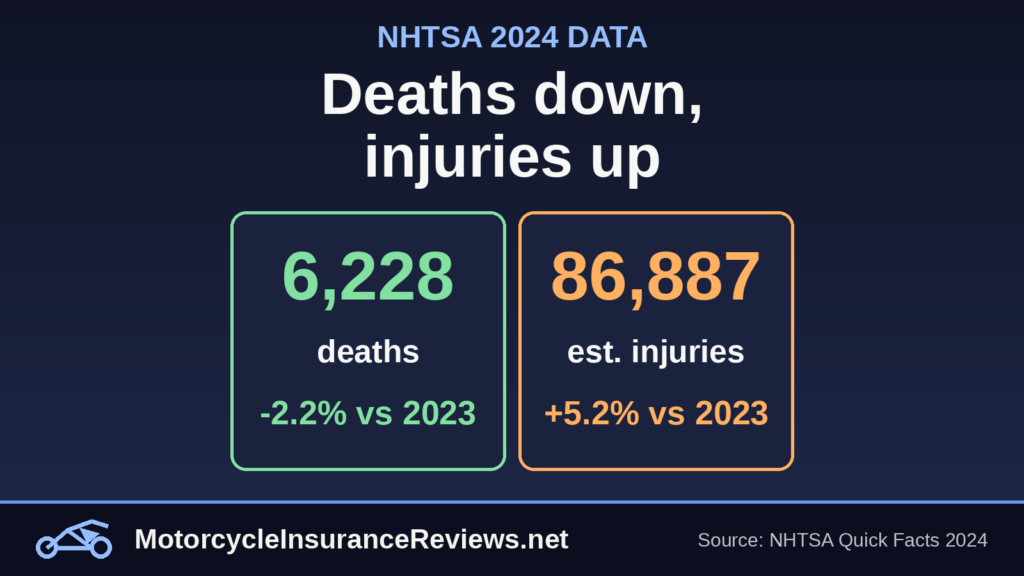
Two numbers moved in opposite directions in the federal government’s latest motorcycle crash figures. Motorcyclist deaths fell in 2024, to 6,228. Estimated motorcyclist injuries rose, to 86,887.
Both come from NHTSA’s “Quick Facts 2024” report (DOT HS 813 809), released in June 2026. They describe crashes in 2024, not this year, and they’re easy to over-read in either direction. A drop in deaths doesn’t mean riding got safe, and a rise in injuries doesn’t mean it got dramatically worse.
Here’s what the report says, how the pieces fit together, and why the mileage numbers change the story.
The short version
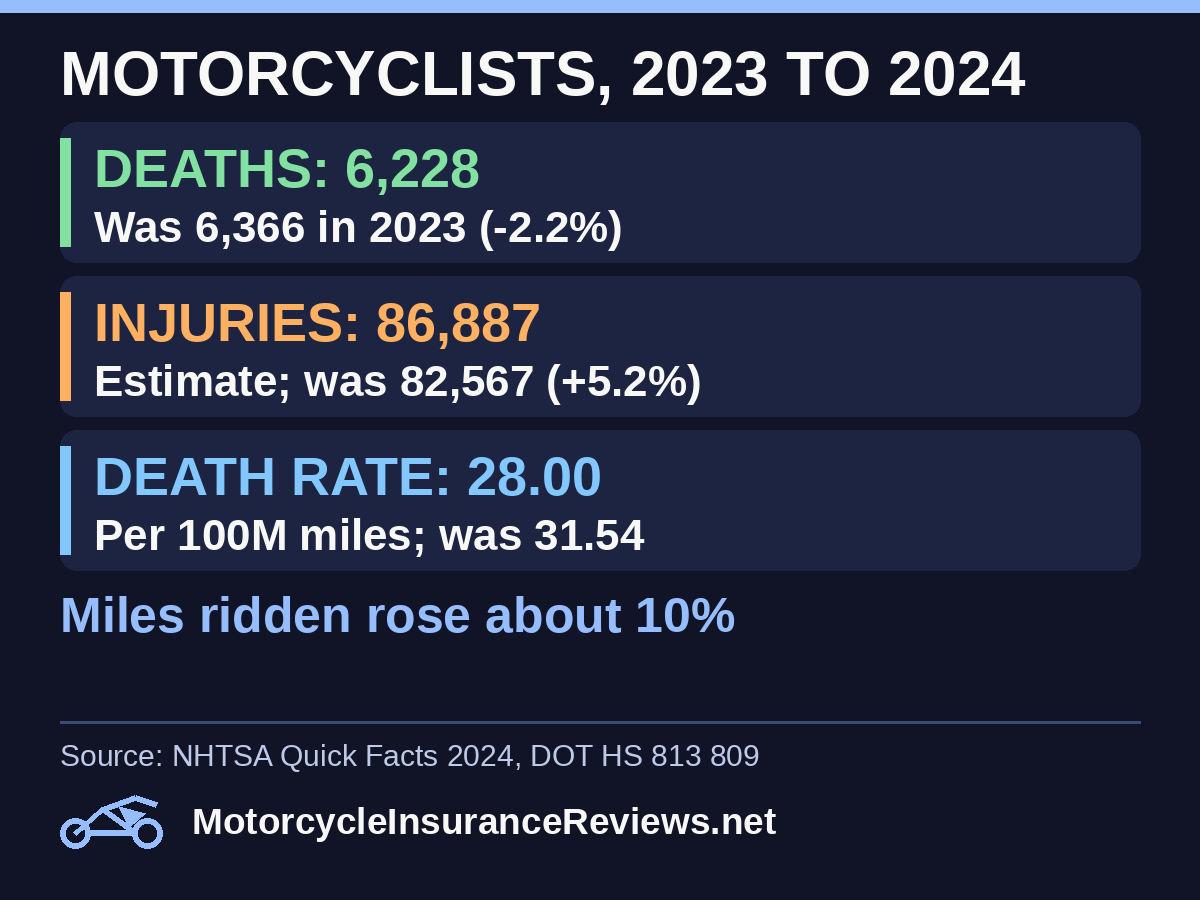
- Deaths: 6,228 motorcyclists died in 2024, down from 6,366 in 2023. That’s 138 fewer, about 2.2 percent.
- Injuries: an estimated 86,887 motorcyclists were injured in 2024, up from 82,567. That’s 4,320 more, about 5.2 percent.
- Death rate: 28.00 per 100 million vehicle miles traveled, down from 31.54.
- Miles ridden: motorcycle travel rose from about 20.2 billion miles to 22.2 billion.
- The caution: none of this shows why the numbers moved.
Deaths and injuries are measured differently
The two headline numbers come from different systems, and that’s worth knowing before you compare them.
The death count comes from NHTSA’s Fatality Analysis Reporting System, known as FARS. It’s a census of fatal crashes. In theory, every motorcyclist death that fits the definition is in it.
The injury count comes from a different place. The report credits FARS and CRSS, the Crash Report Sampling System. CRSS draws on a sample of police-reported crashes and scales up to a national estimate. That’s why the injury number is called an estimate. It isn’t a count of every injured rider, and NHTSA’s quick-facts table doesn’t show the margin of error around it.
So when the table says injuries rose by 4,320, treat that as a best estimate with some uncertainty in it. The death figure is firmer.
Why the mileage matters
Raw counts ignore how much riding happened. The report includes the federal highway agency’s estimate of motorcycle miles traveled:
- 2022: 23,765 million miles.
- 2023: 20,181 million miles.
- 2024: 22,241 million miles.
Motorcycle mileage rose by 2,060 million miles from 2023 to 2024, which is roughly 10 percent. That’s why the death rate fell faster than the death count. NHTSA calculates the rate by dividing deaths by miles, and it works out to:
- 2022: 26.30 deaths per 100 million miles.
- 2023: 31.54.
- 2024: 28.00.
By that measure, 2024 was about 11 percent better than 2023. But it was still above 2022’s 26.30. That’s because 2022 had about the same number of deaths (6,251) spread over more miles (23,765 million).
The same arithmetic applies to injuries. Our own division, using the report’s numbers, puts estimated injuries at about 391 per 100 million miles in 2024 and 409 in 2023, a drop of around 4.5 percent. That’s our calculation, not an NHTSA figure, and it rests on an estimated injury count. But it shows how a count can go up while the rate goes down.
One more number puts the mileage in perspective. FHWA’s registration data in the report lists about 9.26 million registered motorcycles in 2024, down from about 9.52 million in 2023. Dividing the miles by the registrations gives roughly 2,400 miles per registered motorcycle in 2024, versus roughly 2,100 in 2023. That’s rough arithmetic from two estimates. Even so, it suggests the average registered bike was ridden more.
How motorcycles compare with cars
The report breaks out occupant fatality rates by vehicle type, using the same per-mile measure:
- Passenger cars: 1.05 per 100 million miles in 2024.
- Light trucks: 0.63.
- Large trucks: 0.28.
- Motorcycles: 28.00.
Dividing the motorcycle rate by the passenger car rate gives about 26.7, which is usually rounded to 27. In words, per mile traveled, motorcyclists died at roughly 27 times the rate of passenger car occupants.
That’s a population-level comparison. It isn’t each rider’s chance of dying on a trip. Your own risk depends on a long list of things the table doesn’t cover, from how you ride to what you wear and when and where you ride.
What the report says about helmets and alcohol
Two other numbers in the report get quoted a lot, and both are easy to misstate.
- Helmets: 2,045 motorcyclists who died in 2024 were not wearing helmets. NHTSA gives that as 34 percent of motorcyclist deaths where helmet use was known. That’s down from 2,171 (35 percent) in 2023 and 2,257 (37 percent) in 2022. It’s a share of deaths, not a share of all riders. It doesn’t say that 34 percent of riders skip helmets.
- Alcohol: 25 percent of motorcycle operators involved in fatal crashes had a blood alcohol concentration of .08 or higher in 2024. That’s the same as passenger car drivers, and it was 26 percent in 2023 and 28 percent in 2022. It describes riders in fatal crashes, not riders overall.
Neither number shows that a helmet, a law or a campaign caused a change. The report is a table of observations, not a study of causes.
Why the 2023 numbers look odd
If the death rate jumped from 26.30 in 2022 to 31.54 in 2023, the first question is what happened. Looking at the table, the answer is mostly the denominator. Deaths were nearly flat, 6,251 in 2022 and 6,366 in 2023, but the federal mileage estimate fell from 23,765 million to 20,181 million miles. Fewer miles with about the same deaths makes a higher rate.
That’s worth keeping in mind for 2024 too. The mileage figure is an estimate, and when it swings by double digits from one year to the next, the rate swings with it. The report doesn’t explain why the 2023 mileage estimate dropped and then recovered, so be cautious about treating any single year’s rate as a trend. The three-year view (26.30, 31.54, 28.00) says more than any one of them.
The death count is the steadier number here. It sat within about 140 of the same level in all three years, which is one reason a small year-over-year change like 2.2 percent shouldn’t be treated as a turning point.
How to read these numbers without over-reading them
A few rules of thumb:
- Keep the year straight. These are 2024 crashes, published in 2026. They aren’t this year’s totals.
- Count versus rate. A smaller count can come with a worse rate if mileage dropped, and a bigger count can come with a better rate if mileage rose. Check which one a headline is quoting.
- Estimate versus census. Deaths are counted. Injuries are estimated.
- Don’t assign a cause. NHTSA’s table doesn’t say whether better gear, different weather, changes in who’s riding or something else drove the shift.
The figures at a glance
- Motorcyclist deaths: 6,251 (2022), 6,366 (2023), 6,228 (2024).
- Motorcyclists injured (estimated): 82,690 (2022), 82,567 (2023), 86,887 (2024).
- Death rate per 100 million miles: 26.30, 31.54, 28.00.
- Motorcycle miles traveled (millions): 23,765, 20,181, 22,241.
- Unhelmeted deaths: 2,257, 2,171, 2,045.
What we don’t know yet
- Why it moved. The quick-facts tables don’t explain the change.
- How precise the injury estimate is. The table doesn’t show a margin of error, so a 5.2 percent rise could be partly sampling noise.
- Where it happened. This report is national. It doesn’t break out states, bike types or rider ages for motorcycles.
- 2025 and 2026. Later years aren’t in this report.
For riders, the safest use of the report is as context rather than a verdict. Deaths per mile are still far higher than in a car, and the data can’t tell you what to change. What it can tell you is that the picture is more mixed than any single headline number.
References
- NHTSA, “Quick Facts 2024,” DOT HS 813 809 (June 2026) — motorcyclist deaths and injuries, fatality rates, vehicle miles traveled, registrations, unhelmeted deaths and blood alcohol figures.
- U.S. National Transportation Library catalog record for NHTSA “Quick Facts 2024” — confirms the report identity and its DOI, 10.21949/cfan-q165.